← Back to Work
ENTERPRISE AI · WEALTH MANAGEMENT · ANALYTICS

Info to
Insights

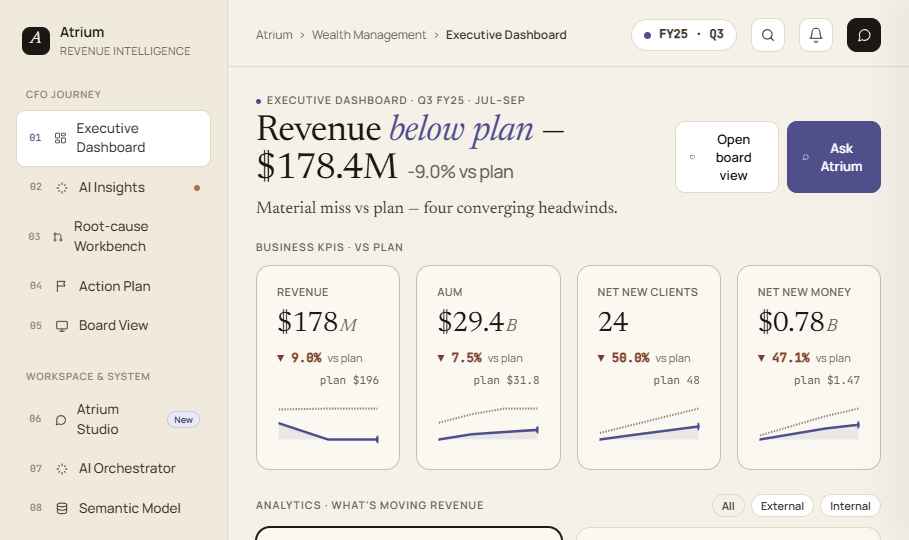
An AI revenue-intelligence platform — Atrium — that helps a wealth-management CFO move from fragmented dashboards to a single, explainable narrative: knowing not just what changed, but why.

ROLE
UX Design Intern
TIMELINE
3-month engagement
TOOLS
Figma · Power BI
TEAM
PO · SMEs · Data eng.
atrium.app / revenue-intelligence
Atrium Revenue Intelligence executive dashboard

Atrium — the CFO opens to a revenue narrative, not a wall of charts.

00 — THE 30-SECOND VERSION

Most analytics tools show you the chart. Almost none tell you the story.

Traditional dashboards bury business users in graphs and tables. I designed an insight-first experience that surfaces KPIs, regional views, and root causes as a clear, decision-ready narrative.

THE ASK

A vision for analytics business users actually understand — insight-first, not chart-first — to justify a platform investment.

WHAT I MADE

Atrium: an AI revenue-intelligence platform with a centralized orchestrator, explainable insights, and human-in-the-loop validation.

WHY IT MATTERS

It turns days of fragmented analysis into minutes of explainable, board-ready narrative the CFO can defend.

01 — THE CHALLENGE

Banks don't fail for lack of data.

They fail to connect cause, context, and consequence fast enough. In wealth management, revenue lives or dies on fees — and when fees dip, no one can say why in time to act.

A CFO sees outcomes, but not drivers. By the time a decline surfaces, the root cause is already buried under fragmented reports.

−10% revenue

a material quarterly miss with four converging headwinds — weather, staffing, client withdrawals, and market conditions — none of them obvious in a standard dashboard.

01

Outcomes without drivers

No clear attribution means delayed decisions — the "why" arrives long after the quarter closes.

02

Fragmented across silos

Data sits in disconnected systems; every insight requires manual assembly across teams and tools.

03

Explaining the past, not preparing for the future

Too many reports, no narrative. External factors are underestimated and rarely modeled ahead of time.

02 — WHO I DESIGNED FOR

The CFO who has to explain the quarter.

ST
"ROOT-CAUSE EXPLORER"
Sally Thompson
  • // CFO, Wealth Management
  • // New York, NY · 20+ yrs in financial services
  • // 100 advisors across 25 US regions
  • // Owns revenue, profitability & board reporting
  • // Relies on many teams → slow, fragmented

"I need to understand exactly what's driving the revenue — especially when external factors like market conditions or extreme weather disrupt performance."

Before every board meeting, Sally must understand what changed, explain why it changed, and recommend what to do next — across senior advisors, analysts, 25 regions, and AUM performance.

Today that means stitching together multiple teams and systems. I turned her recurring needs into three user stories that shaped the product:

STORY 01

As a CFO, I want to see what's driving a revenue change — not just that it changed — so I can explain the quarter to my board with confidence.

STORY 02

As a CFO, I want to validate and edit the AI's reasoning, so the final narrative is mine — and defensible under scrutiny.

STORY 03

As an analyst, I want self-serve root-cause analysis, so I'm not waiting days on the data team to answer "why."

03 — THE APPROACH

Four bets that made the AI trustworthy.

I partnered with senior designers, in-house SMEs, and data engineers — and built a synthetic CFO persona via prompt engineering to simulate real analytical behavior, mapping objectives → behaviors → measurable signals.

BET 01

Centralized AI Orchestrator

One intelligence layer automates data blending and root-cause analysis across every silo.

BET 02

Human-in-the-loop

CFOs and analysts refine, validate, and adjust every AI insight before it ships.

BET 03

Omnichannel by default

Insights stay consistent across Power BI, Teams, and presentation tools — wherever the work happens.

BET 04

Explainable, not just smart

Every insight moves from "what" to "why," with a traceable causal chain the board can trust.

04 — THE USER JOURNEY

From "why did revenue drop?" to a board-ready answer.

I mapped the CFO's path end-to-end, pairing each step with the role the I2I platform plays — and how Sally feels along the way.

↔ scroll to follow the full journey

01 · TRIGGER

Reviews quarterly revenue

I2I: anomaly-detection alerts flag the dip
😟
02 · EXPLORE

"Why did revenue drop?"

I2I: orchestrator routes the question
😕
03 · INTEGRATE

System pulls datasets

I2I: semantic layer unifies sources
😐
04 · ANALYZE

Patterns across regions

I2I: root-cause engine runs
🤔
05 · INSIGHT

Reviews AI insights

I2I: explainable, cited insights
🙂
06 · HUMAN LOOP

Validates & refines

I2I: editable insights + run history
🙂
07 · DECIDE

Defines strategy

I2I: scenario modeling + recs
😌
08 · REPORT

Presents to board

I2I: auto-generated narrative
😄
05 — THE SOLUTION

Atrium — try the live prototype.

A working revenue-intelligence console for the CFO. Click through the CFO Journey on the left: Executive Dashboard, AI Insights, Root-cause Workbench, Action Plan, and Board View.

atrium.app / revenue-intelligence
Open full prototype ↗ Interactive · best viewed full-screen
10% drop, explained

Atrium quantified the revenue decline and attributed it to weather, staffing, and client behavior — turning a descriptive dashboard into a causal explanation the CFO can act on.

Executive Dashboard AI Insights · what's moving revenue Root-cause Workbench Human-in-the-loop edits Auto board narrative
06 — THE IMPACT
PRIMARY BUSINESS OUTCOME

Increase the percentage of business decisions driven by actionable, self-serve insights.

I mapped each UX driver to a measurable metric and the business outcome it unlocks — so design value stayed legible to business stakeholders.

Clarity & Comprehension

METRIC Insight clarity score · fewer clarification cycles
OUTCOME Faster understanding of performance

Guided Reasoning

METRIC % completing structured analysis
OUTCOME Consistent root-cause across scenarios

Trust & Explainability

METRIC Confidence score · repeat usage
OUTCOME Higher adoption in board decks

Speed to Insight

METRIC Time to insight (days → minutes)
OUTCOME Timely quarterly decisions

Actionability

METRIC % insights converted to action plans
OUTCOME Direct impact on strategy

User Empowerment

METRIC % self-serve analysis by SMEs
OUTCOME Reduced dependency on data teams
07 — WHAT I LEARNED

For executives, trust comes from explainability — not cleverness.

The breakthrough wasn't a smarter model; it was making the AI's reasoning editable and traceable, so Sally owns the narrative she takes to the board. Human-in-the-loop wasn't a feature — it was the whole point.

Next, I'd pressure-test the causal chains with real finance teams and design the moments where the AI is uncertain or wrong — because that honesty is where executive trust is truly earned.